


Zunoy Uptime V2 is live. It watches more of what your business depends on, helps your team fix things faster, and keeps your customers in the loop while you do. It also brings two AI tools (MCP Server and AI Agent) and a fresh new look. Fewer surprises, we hope.
Catch problems earlier
“Is my site up?” is only the start. V2 adds ten new monitor types, so you can check the parts that break quietly. As of November 2026, Zunoy Uptime offers 22 monitor types in total.
Synthetic monitors
Test the journeys your users actually take, on a schedule, instead of waiting for them to tell you something broke. Each check runs every step, not just the last page. How synthetic monitoring works.
- API chain: Run a series of API calls in order, pass data from one response to the next, and check every step. No browser needed.
- Browser script: Write a script that opens your site in a real browser, clicks buttons, fills in forms and checks the results. Good for teams who are comfortable with code.
- Browser flow: Build the same kind of journey visually, step by step, without writing any code. For example: open the login page, enter your details, click Sign in and check that the dashboard loads.
More than your website
- DNS: Hear about DNS problems before your visitors do.
- Real User Monitoring (RUM): See how your site performs for real visitors, from their actual sessions.
- Visual ping: Compare how a page looks over time, and catch layout shifts, missing buttons, broken images or defacement.
- Page speed: Run scheduled Google Lighthouse checks on mobile and desktop, and track Core Web Vitals, which measure how fast a page loads and responds.
- Domain/WHOIS: Keep an eye on your domain’s WHOIS details.
- Email blacklist: Find out if your sending addresses end up on a blacklist.
- Email deliverability: Check that your emails reach the inbox.
One small rename: the HTTPS monitor is now called HTTP.
Fix things faster
When something breaks, everything you need is now in one place, and the right person hears about it.
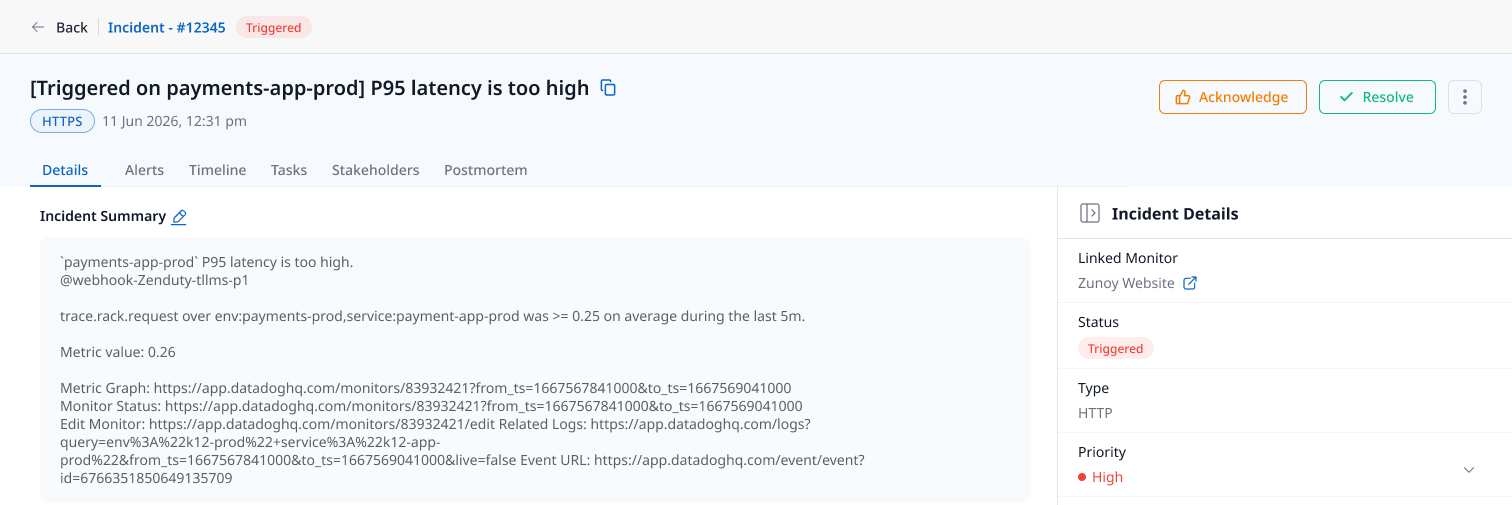
Incident tasks and stakeholders
Create tasks inside an incident, assign them to teammates and track them until they’re done. Add stakeholders to the incident and email them from right there. With sender emails, those emails come from your own domain.
Recovery playbooks
Connect a recovery playbook to a monitor. If the monitor goes down, the playbook runs automatically, so the first fix can start before anyone opens a laptop.
Escalation policies and on-call schedules
Build your own alerting flow: who gets alerted, and when.
Keep customers in the loop
Status pages also got the biggest upgrade in V2.
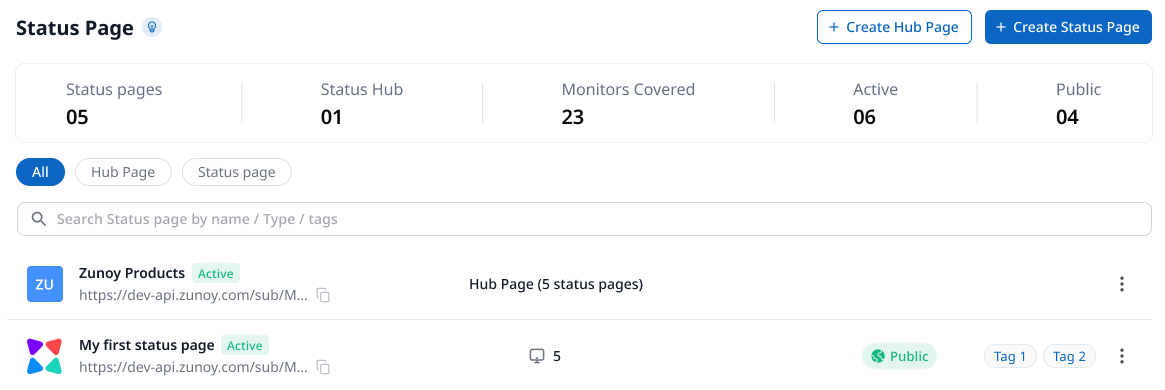
Status page hubs
Keep a collection of status pages in one place, under your own custom domain. Handy when you run more than one product or serve more than one client.
See who’s looking
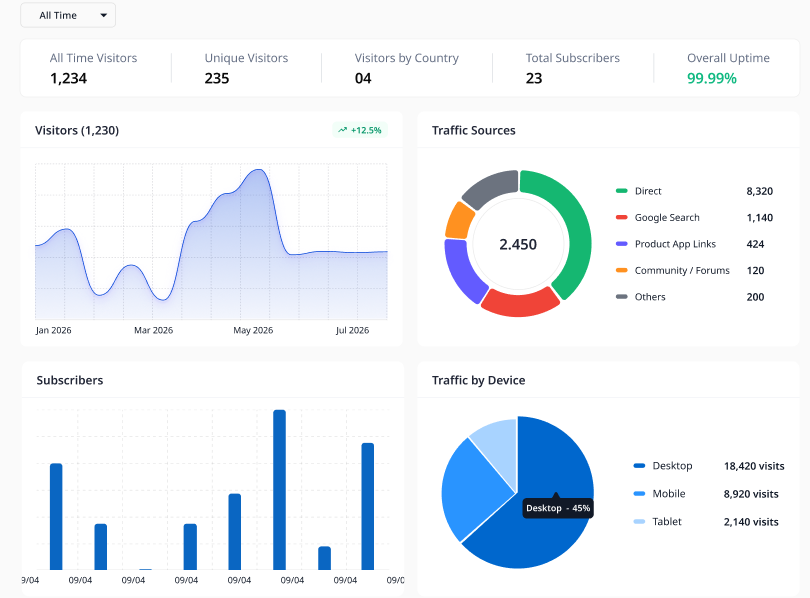
Status page analytics show your visitors, where they came from, their device and country, and a heat map.
Make it yours
- Choose from several fonts or use your own, set primary and secondary colors, add header and footer links, and use a different logo for dark and light themes.
- Pick a default timezone and date format. Visitors can switch the timezone themselves.
- See every change in a live preview as you edit.
- Customize the emails your subscribers receive.
Control who can see it
Keep a status page private to workspace members, or restrict it by IP address, email or password.
Show your status anywhere
- Embeddable widgets show one status page’s current status on any website. You can change the color, position and some of the look.
- Components are display-only items you can add to a status page without a real monitor behind them.
- Activity history shows what changed on each status page, with full details.
Stay secure and in control
Vault
Store secrets once, then use them in monitors and recovery playbooks instead of pasting them in: tokens, usernames and passwords, certificates, and TOTP / MFA codes.
Audit trail
A log of every action taken in your workspace, so you always know who changed what.
Tags, in one place
Create tags with descriptions in one central place, then use them across your monitor and status page lists.
Reports
Pick the modules (incidents, monitors, team usage) and a duration, then view and download the report. Past reports are kept, so you can download them again any time. You can also get weekly and monthly report emails, and add other people to receive them.
AI in Uptime (Beta)
Uptime V2 brings two AI tools that work together: MCP Server sets things up, and the AI Agent explains what happened. Nobody enjoys piecing logs together at 2 AM, so now you don’t have to start from zero.
MCP Server: just ask
MCP Server connects Zunoy Uptime to AI tools like Claude, or to your terminal or IDE. Create monitors, check their status and change alert settings in plain language, without opening the dashboard:
- “What’s the status of checkout.zunoy.com?” gets you the current state, mid-conversation.
- “Only alert me if it fails three times in a row” updates the sensitivity right away.
AI Agent: the incident summary, written for you
When something breaks, the AI Agent writes a summary of what happened, explains the impact and suggests a next step. A person still closes the incident. Once it’s over, an AI-written postmortem gives you a draft to edit instead of a blank page.
You stay in control
Choose the AI provider you prefer, track your AI credit usage, and read a log of everything AI caught while you were offline.
A fresh new look
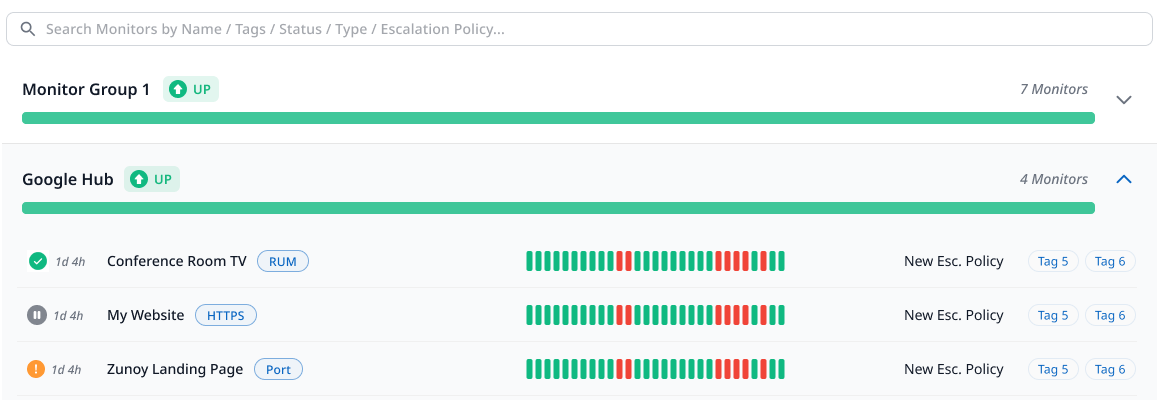
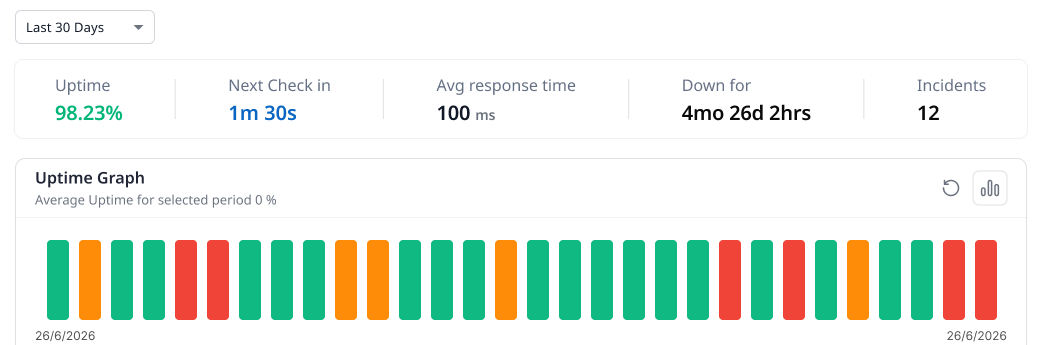
Uptime V2 has a new design. Every module, from monitors and status pages to on-call and the vault, now sits in one sidebar, and you can group monitors so each group shows its status at a glance. A monitor’s page now shows its uptime, response time and incidents at a glance, with the details alongside.
Everything in this release
Monitors
- Changed: HTTPS monitor renamed to HTTP
- New: DNS monitor
- New: API chain
- New: Browser script
- New: Browser flow
- New: Visual ping
- New: Page speed
- New: Real User Monitoring (RUM)
- New: Domain / WHOIS
- New: Email blacklist
- New: Email deliverability
Incidents and on-call
- New: Incident tasks
- New: Incident stakeholders
- New: Recovery playbooks
- New: Escalation policies and on-call schedules
Status pages
- New: Status page hubs
- New: Analytics
- New: Private access
- New: Customization
- New: Timezone and date format
- New: Live preview
- New: Subscriber email templates
- New: Activity history
- New: Components
- New: Embeddable widgets
Security and workspace
- New: Vault
- New: Audit trail
- Improved: Tags and labels
- New: Sender emails
Reports
- New: Data export
- New: Report history
- New: Weekly and monthly report emails
AI and design
- New: MCP Server
- New: AI Agent
- Improved: New design
Already using Zunoy Uptime? Open Uptime and add your first new monitor type or status page hub.
New to Zunoy? Start monitoring free.
Questions or feedback? Write to support@zunoy.com. We always love to hear what you think!
